How to make developers happy
Summary
I analyzed if a model is able to predict the job satisfaction based on different framework. We will use the CRISP-DM Pattern here:
- Section 1: Data Understanding - We will look at different, relevant columns of the dataset and extract some numbers from them.
- Section 2: Data Preparation - All steps that where required to transform the data in a way for fit into a model.
- Section 3: Modeling - What models to choose from
- Section 4: Evaluation - What was the best model
- Section 5: Deployment: We will not handle this topic, as this models will not be deployed somewhere
- Section 6: Improvements
Happy Reading!
Section 1: Business Understanding
Can you be more happy in a different programming language? In this blog post I will try to provide that this is actually true, given the data of the stackoverflow survey of 2020.
The three main questions we will focus on are:
- What is the general job satisfaction, more positive or more negative?
- Is the job satisfaction correlated with some programming language, framework or platform?
- Are we able to predict a job satisfaction based on this data?
I will try to answer this questions in this blog post.
Stack Overflow
We will be using the latest stackoverflow survey data, collected in 2020. Stackoverflow itself is a huge platform where (not only technical) users can ask questions, tag this by the topic and than the community will answer this questions. For a lot of questions already answers are provided, so often we don't need to write a new questions on the platform but instead get fast answers for our (software) problems.
Section 2: Data Understanding
If you are already familiar with the stackoverfow data, feel free to skip this part. It can be obtained from here: https://insights.stackoverflow.com/survey/ (to have the same result, please use the data from 2020).
The data of stackoverflow contains a lot of columns (61 in total). Most of the data is a string of a set of possible answers. Only a small amount contains floating point values. In total, we have 64461 answers, where about 70% (45194) contain an answer related to their current job satisfaction.
The job satisfaction can have (only) one value. Given their description, I assume an order:
- Very dissatisfied (negative)
- Slightly dissatisfied (light negative)
- Neither satisfied nor dissatisfied (neutral)
- Slightly satisfied (light positive)
- Very satisfied (positive)
Section 3: Data Preparation
Selection
For all remaining analysis, I removed each element that don't have a value in the column job satisfaction. This also cleans the data for the analysis.
Construction
I created new columns out of the existing ones in order to extract the features we want to analyze. This was done for JobSat, PlatformWorkedWith, MiscTechWorkedWith and LanguageWorkedWith.
Section 4: Data Modeling
To create a model based on the job satisfaction, we first need to convert the Job satisfaction answers into one column. This can be achieved using several approaches. I will try two and compare them using the r2-score.
Binary Classification
For the binary classification approach, we will be using Very satisfied as a positive example, and all other as negative examples. We will merge all extracted features (from Platform, Misc Tech and Programming Language) into our model.
This gives us 14611 positive examples and 30583 negative examples. No re-balancing required.
After training we got following confusion matrix:
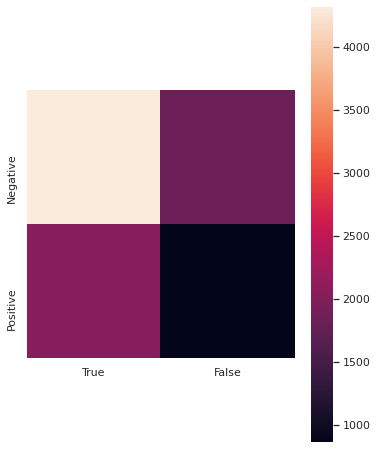
A best result would be no entries in the "false" column, but we have some thousand of them. On the other side is the true negative value high. That is a good indicator for our model, as we predict all examples not belonging to the satisfied group more accurate.
Linear Regression
My second approach is to model this problem as a regression problem, so we want to predict the job satisfaction as a float value. I mapped every satisfaction level to a float value using the following table:
| positive Column | Value |
|---|---|
| Very satisfied | +2 |
| Slightly satisfied | +1 |
| Neither satisfied nor dissatisfied | 0 |
| Slightly dissatisfied | -1 |
| Very dissatisfied | -2 |
Section 5: Evaluation
Question 1: What is the general job satisfaction, more positive or more negative?
Slightly satisfied have a count of 13930 and Very satisfied have a count of 14611, having a total of 28541.
I will ignore the Neither satisfied nor dissatisfied as we don't know if its positive or negative.
Slightly dissatisfied have a count of 7124 and Very dissatisfied have a count of 3746, having a total of 10870.
The majority of answers given are more positive even when we would consider the option Neither satisfied nor dissatisfied as negative.
Question 2: Is the job satisfaction correlated with some programming language, framework or platform?
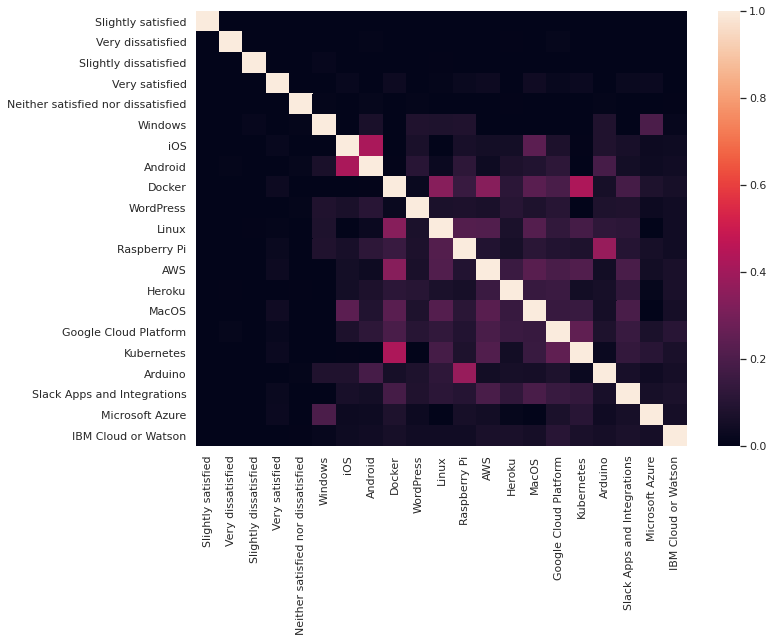
Following platform indicate a positive relation to the Very satisfied Job satisfaction:
- Docker
- Raspberry Pi
- MacOS
- Kubernetes
- Slack
- Microsoft Azure
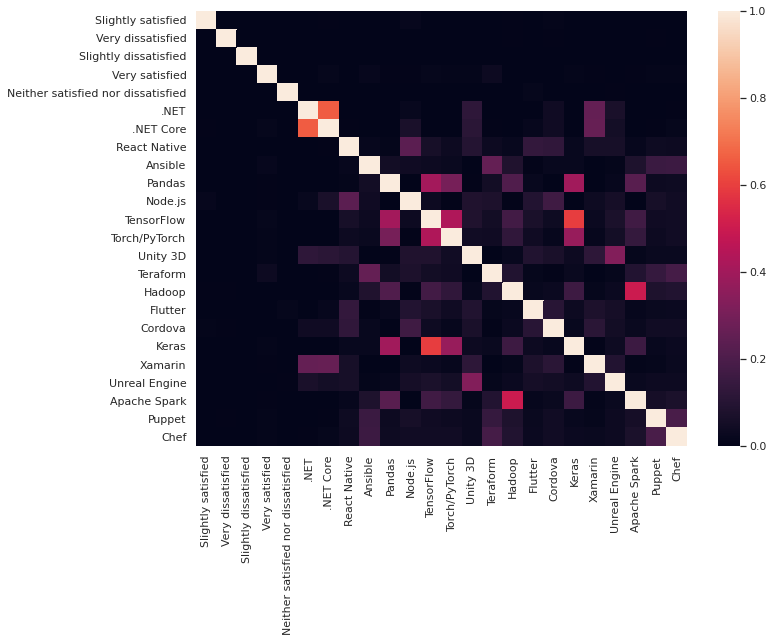
Only the Technology Terraform have a bit of a positive influence. The other have non or only so small that its barly visible in the heatmap.
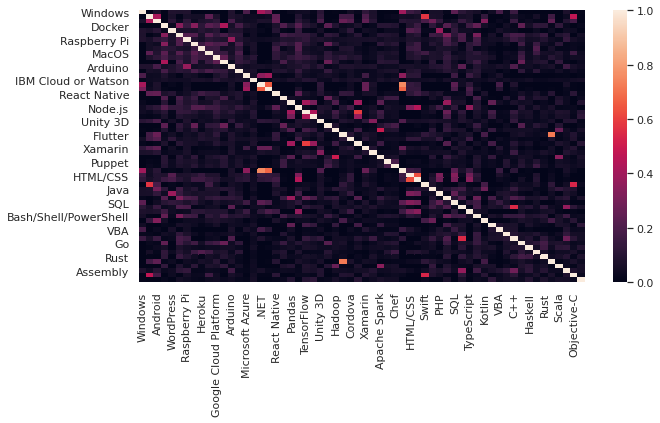
And finally we will take a look on the programming language used vs the job satisfaction.
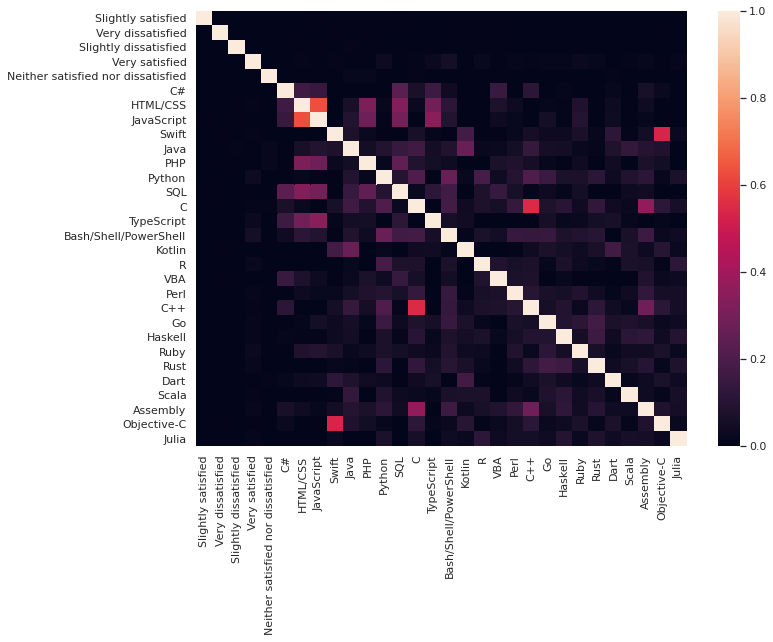
Happy to know: Python, Typescript and Bash/Shell/Powershell show a positive correlation with the job satisfaction.
But the boxes are only a little bit brigter than the surrounding ones, sometimes you can't event see them directly.
Their seems to be small amount of positive technologies that are correlated with the job. But from the visualizations we saw, this positive influence is very small.
Question 3: Are we able to predict a job satisfaction based on this data?
| Category | Model | r2 score train | r2 score test |
|---|---|---|---|
| Binary | Decision Tree | 0.711 | -0.95 |
| Regression | Linear | 0.001 | 0.006 |
I build a binary classifier using the decision tree algorithm and a linear regression model. Both did not perform good on the test set. The decision tree did ok on the train set.
We are not able to predict the job satisfaction based on the technologies used.
Section 6: Improvements
You can add more features like I did do have even more columns available for training a model, but remember that this will also increase the memory and runtime requirement for your model.
Another option would be to add the earlier historical data from other surveys of StackOverflow. This will make the preprocessing more challenging, as new options may have been added to the survey in each year.
And you can play around with different model, that may be able to handle the data like a (deep) neuronal network.
Thank you
When you read until this part, I want to say thank you! You can find the source code of this post on by github page github page - feel free to check it out.
Their is even more in the survey data that could have be used, like the salary, but I did not include it here because I just wanted to focus on the used technologies.